In hybrid and cloud-native environments, monitoring custom services and background jobs on VMs is critical for uptime and actions. In this article, we’ll walk through how to collect service status logs (e.g., running/stopped) from Azure VMs and push them to a custom Log Analytics table using Data Collection Rules (DCRs).
Use Case Overview:
- Monitor services like nginx, MySQL, or any custom service.
- Automate log collection using bash + cron.
- Centralize logs in Azure Monitor for querying, alerts, and dashboards.
Architecture Diagram
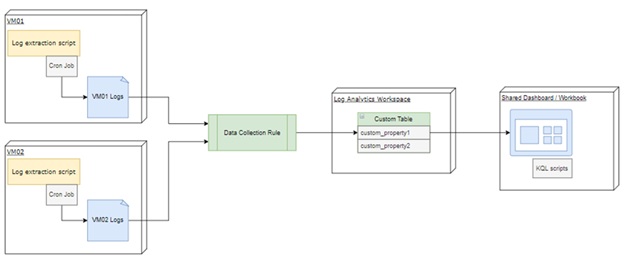
Illustration diagram — showing VM, log file, DCR, Log Analytics
Step 1 – Generate Service Status Logs on the VM
We have written a Bash script that checks the status of required services and appends the results to a .log file.
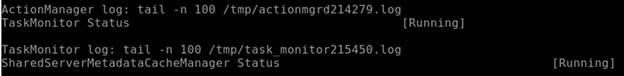
The script will run on each machine and read the installed services statuses and then generate custom logs with a custom format. We generated the logs to have comma-separated data, with standard log format for ingestion — server name, service name, status.
VM01, TaskMonitor,Running
VM01, Cache Manager, Running
Step 2 – Configure the Crontab Job
We added a cron entry to run the script periodically.
The following example shows the cron Job for Azure Cloud Monitoring under That runs every 3 minutes:
*/03 * * * * /root/home/user/az_monitoring/az_monitoring.sh > /dev/null 2>&1
PS: It’s recommended that the script is placed in a private directory or secure location.
Step 3 – Set Up the Custom Log File Directory
Ensure proper log directory/file permissions.
-rw-r–r–. 1 user group 167713 Aug 20 12:18 az_service_status_vm01_20250820.log
Step 4 – Create the Custom Table in Log Analytics
Azure automatically creates a table if it doesn’t exist when you configure a DCR, but you can also define a schema in advance.
The custom table should have the columns: RawData + TimeGenerated, where RawData will contain the log lines read from the .log file.
TimeGenerated will contain the timestamp at which the log was ingested into the custom table.
Example Table Name: LinuxServiceStatus_CL (_CL is an automatic addition that means Custom Logs)
Step 5 – Create a Data Collection Rule (DCR)
Use Azure Portal, ARM template, or CLI to create the Data Collection Rule.
Example: CLI to create a DCR
  az monitor data-collection rule create
  --resource-group
  --name LinuxServiceLogDCR
  --location
  --data-flows '[{"streams":["Custom-LinuxServiceStatus_CL"],"destinations":["la-workspace"]}]'
  --data-sources '[{"streams":["Custom-LinuxServiceStatus_CL"],"filePatterns":["/log/custom/az_service_status_*.log"],"name":"linuxServiceLogs","format":"text"}]'
  --destinations '[{"type":"logAnalytics","workspaceResourceId":"","name":"la-workspace"}]'
Step 6 – Link the DCR to Your Azure VM
Either from portal or CLI:
  az monitor data-collection rule association create
  --name LinkLinuxLogs
  --rule-name LinuxServiceLogDCR
  --resource
  --description "Link service status log rule to VM"
Step 7 – Validate Logs in Log Analytics
After finishing the previous steps, go to your Log Analytics Workspace, open Logs from the left blade and run a simple query:
  LinuxServiceStatus_CL
  | sort by TimeGenerated desc
You will get a table of logs raw data and its generated timestamps.
Query Examples: KQL for Insights
Example query of service availability breakdown / detect services That Were Down
  LinuxServiceStatus_CL
  | parse RawData with ComputerName: string "," ServiceName: string "," ServiceStatus: string
  | where Status == "stopped"
  | where Server == "VM01" and ServiceName == "Task Monitor"
  | project TimeGenerated, Server, ServiceName, Status
  | order by TimeGenerated desc
Bonus: Visualize with Azure Workbook
Create an Azure Workbook to visualize:
- Pie chart of services against statuses
- Timechart of service activity
- Alerts based on downtime thresholds
Security and Best Practices
- Use managed identities and role-based access control (RBAC).
- Avoid writing logs with root privileges.
- Use the Azure Monitor Agent (AMA), not legacy OMS agents.
Conclusion
By combining custom logs with DCRs, you can build a robust and adaptable monitoring pipeline for services running on Azure VMs. This approach ensures high availability, supports scaling needs, and offers rich, query-friendly observability.